


Characteristics of an electrolysis cell
An electrolysis cell is used frequently in chemistry to obtain chemicals from common other chemicals. A well-known example is the electrolysis of common table salt for obtaining sodium hydroxide and chlorine gas. Home chemists also use the electrolysis of sodium chloride for obtaining chlorate salts. A good description of that process is given at the site of Wouter Visser. There is no need to elaborate on that process over here again.
At this page, a more theoretical experiment is performed in order to obtain more insight in the properties of an electrolysis cell. From an electrical point of view, an electrolysis cell can be regarded as a non-linear resistor.
In this experiment an electrolysis cell is made with well-determined properties and current is determined as function of voltage.
From this characteristic some other interesting properties can be derived.
![]()
![]() Required
chemicals:
Required
chemicals:
-
sodium chloride
![]() Required
equipment:
Required
equipment:
-
beaker, 200 ml
-
adjustable power supply
-
graphite rods
-
volt meter
-
ampere meter
![]() Safety:
Safety:
-
In this experiment a small amount of chlorine gas is released. When the electrolysis only is allowed to run for reading voltages and currents, then there is not a real problem, but the electrolysis should not be allowed to run for a longer time, when it is performed inside.
-
The power supply used must have a built in current limitation. Do not use a car battery for these experiments. These batteries can produce tremendous amounts of current, if short-circuited or if electrolysis is performed with full 12 V.
![]() Disposal:
Disposal:
-
The solution of salt can be flushed down the drain without problem.
![]()
The setup, used in the experiment
![]() Sodium
chloride is weighed. For this experiment 33 grams were used. This amount is
quite arbitrary, it must be such that it dissolves without problem in around 150
ml of water.
Sodium
chloride is weighed. For this experiment 33 grams were used. This amount is
quite arbitrary, it must be such that it dissolves without problem in around 150
ml of water.
![]() A volume of 150 ml of water is taken. The salt and the water
are put in a beaker and all salt is dissolved. This yields a clear and colorless
solution.
A volume of 150 ml of water is taken. The salt and the water
are put in a beaker and all salt is dissolved. This yields a clear and colorless
solution.
![]() A circuit is built, according to the following diagram. It is
important that the volt meter is applied directly in parallel to the
electrolysis cell. Any losses over wires and the internal resistance of the ampere meter then do not
affect the measurements. The ampere meter may be integrated with the used power
supply, or it may be a separate meter.
A circuit is built, according to the following diagram. It is
important that the volt meter is applied directly in parallel to the
electrolysis cell. Any losses over wires and the internal resistance of the ampere meter then do not
affect the measurements. The ampere meter may be integrated with the used power
supply, or it may be a separate meter.
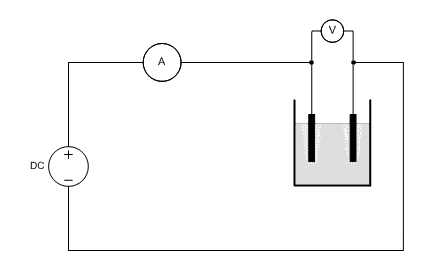
The DC power supply must be adjustable and it must be capable of delivering a maximum output current of 5A or something like that.
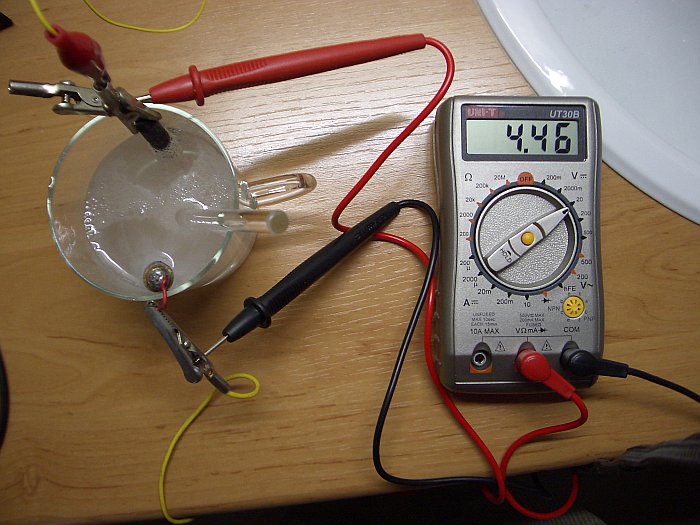
The following picture shows the real setup. The yellow wires with crocodile clamps are connected to a power supply with built in ampere meter. The voltage is measured over the two graphite electrodes, in order to assure that voltages across wires and connectors do not affect the measured voltage across the cell.
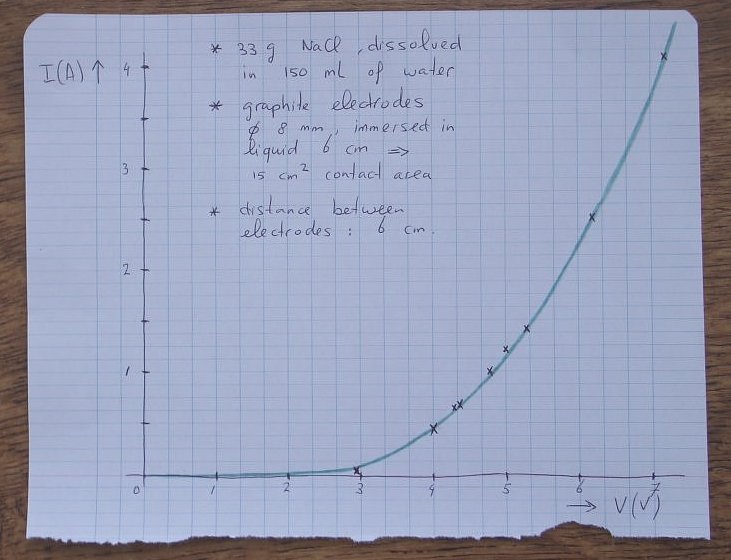
The graphite rods, used in this experiment are rods from a large battery, with a diameter of 8 mm and immersed 6 cm into the liquid. The total contact area between graphite rods and salt-solution is approximately 15 cm˛. The distance between these rods is approximately 6 cm. The graphite rods are treated with linseed oil in order to make them less prone to erosion.
The picture shows the electrolysis cell in action. Bubbles and foam on the surface can clearly be observed on the picture.
![]()
Experimental results
The experiment was performed by turning up the voltage of the power supply. For a certain setting, both the voltage across the cell and the current flowing through the cell were measured. So, not the power supply voltage was recorded, but the actual voltage across the cell.
Below follow some measured results:
| Voltage across cell (volts) | Current through cell (amperes) |
| 2.9 | 0.03 |
| 4.0 | 0.44 |
| 4.3 | 0.62 |
| 4.4 | 0.69 |
| 4.8 | 1.0 |
| 5.0 | 1.2 |
| 5.3 | 1.4 |
| 6.2 | 2.5 |
| 7.2 | 4.1 |
The results are put in a graph. This was drawn by hand and a curve is made through the measured data points. The curve shows that the characteristic of such a cell is highly non-linear. At low voltages (less than 3 volts), hardly any current goes through the cell. At high voltages, the current becomes very high.
A similar experiment was done with the electrodes immersed only 3 cm in the liquid. Yet another experiment was done with a distance between the electrodes of only 1 cm.
The effect of raising the electrodes, such that only 3 cm was immersed in the liquid was quite dramatic. At 5.0 volt, the current dropped from 1.2 A to 0.65 A. The contact area between liquid and electrodes has a strong effect on the observed resistance.
The effect of moving the electrodes towards each other is less dramatic. It is hard to do precise measurements (the distance could not be easily controlled and measured accurately), but the effect is that the resistance decreases. But the effect is not as strong as reducing the contact area of the electrodes.
![]()
Using this characteristic for practical purposes
Once such a characteristic of the electrolysis cell is determined, it can be used for practical purposes, when one wants to set up an electrolysis cell, e.g. for chlorate production.
Suppose you have a fixed 12V power supply and you want to perform electrolysis. Applying 12V directly will not work. The current will be excessive and the power supply may be overloaded and overheat. At least, the liquid will become very hot and the graphite anode will erode very much.
With the graph at hand, one can easily determine what current will be drawn, when a resistor is put in series with the cell. Suppose you build a circuit, according to the following diagram:
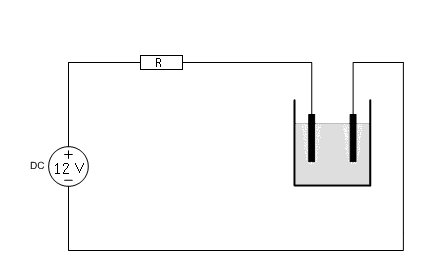
Now, the resistor R must be selected, such that a reasonable current is drawn and such that the power dissipation in the resistor is not excessive. Using the graph of the V-I characteristic, the current, which is drawn for a specific value of R can easily be determined. An example is given here, for R = 4 Ω.
The voltage across the resistor R equals 12 – Vcell, where Vcell is the voltage across the cell. So, one can draw the current through the resistor as function of the cell voltage. For a cell voltage, equal to 0, the current simply equals 12/R. For a cell voltage, equal to 12V, the current equals 0 (no voltage is left for the resistor). A line can be drawn between these two points. Because the cell and the resistor are connected in series, the same current has to go through both of them. This point can easily be determined by drawing the intersection of the graph and the line, which describes the resistor (at that point the currents in both components are the same). At this point, the cell voltage is read and the cell current is read.
An example graph is given below, for the resistor of 4 Ω. At a cell voltage of 0, the current through this resistor equals 12/4 = 3 A. At a cell voltage of 6 V, also 6 V remains across the resistor, so at that point, a current of 6/4 = 1.5 A is drawn. Now we have two points and we can draw a line between these. The intersection of this line with the graph is the real cell voltage and current at which the circuit will work.
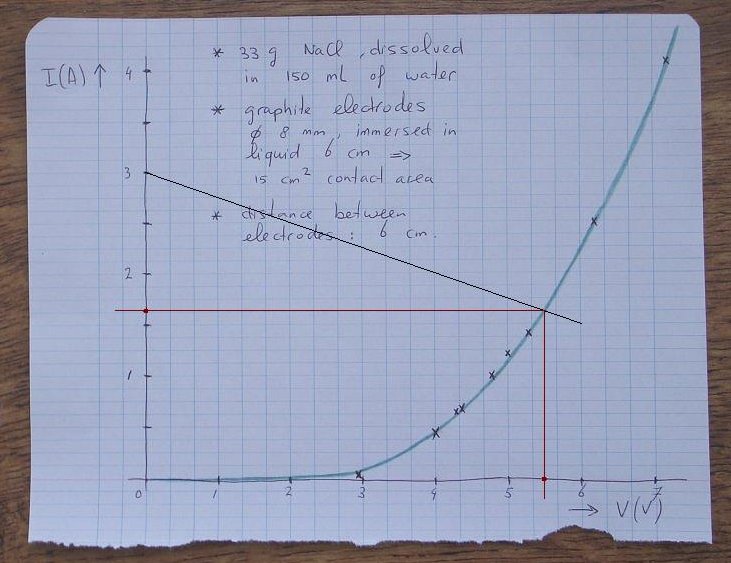
According to the point of intersection, the cell voltage will be approximately 5.5 V and the cell current will be approximately 1.65 A.
What is the power dissipated in the resistor? The cell voltage equals 5.5 V, so the the voltage across the resistor is equal to 12 – 5.5 = 6.5 V. The current through the resistor is 1.65 A. The power, dissipated in the resistor is 6.5×1.65 Watt. This is 10.7 Watt.
![]()
Further subjects to be investigated
The influence of concentration on the graph also is interesting to determine. With increasing concentration of the solution, the resistance will become lower, but how much lower? Doubling the concentration will not decrease the resistance by a factor of 2. The redox potential, for converting chloride to chlorine and water to hydrogen and hydroxide ion must be overcome, regardless of concentration. It would be very nice if such a set of graphs could be obtained for different concentrations. The experiment, as performed here, is done at fairly high concentration, but the solution was not saturated.
![]()
Explanation of results
The results, obtained in this experiment, can be explained from the properties of electrolysis cells. In this section, a model, described as electronic equivalent is derived. An electrolysis cell can well be modeled as a simple electronic circuit and that model can be used to describe the electrical characteristics of the electrolysis cell.
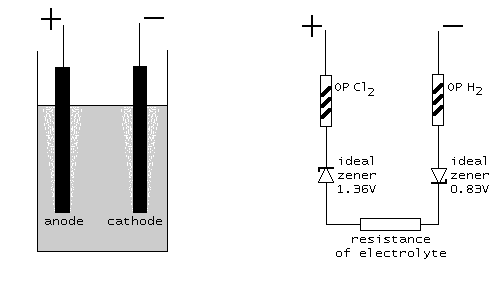
Redox potentials of half reactions occurring at electrodes: cell voltage
In an electrolysis cell, two redox reactions occur. One reaction at the cathode and one at the anode. In this example, the following two reactions occur:
At cathode: 2H2O + 2e → 2OH– + H2 (Ecathode = –0.83 V)
At anode: 2Cl– – 2e → Cl2 (Eanode = +1.36 V)
The voltage Ecathode is the reduction potential for the reaction at the cathode. The voltage Eanode is the reduction potential of the reverse reaction at the anode.
In order to have any reaction, the so-called cell voltage must at least be applied to the cell. The cell voltage Ecell equals Eanode - Ecathode. For the reaction in this experiment, Ecell equals 1.36 – (–0.83) V, which is 2.19 V. This voltage is used up by the process of transferring electrons from/to the chemical compounds.
The power Icell·Ecell, where Icell is the current, drawn by the electrolytic cell, is not converted to heat, but to new chemicals. These new chemicals are more energetic than the original ones. So, electric energy is converted to potential chemical energy.
Interface (contact area) between electrodes and liquid: overpotential
If the applied voltage is below Ecell, then no current can flow at all. No electrons can be transferred from the electrodes to compounds in solution or vice versa. If the voltage is higher than Ecell, then in theory, sufficient potential is available for the reactions to occur, and in that case a current can flow. However, in practical setups, in addition to the redox potentials, an overpotential is needed for each electrode. Additional effort has to be put in the reaction, because electrons have to go from/to the solid metal or graphite rods to/from the liquid, or even to/from a gas.
The total current through the cell depends on the applied overpotential. The higher the applied overpotential, the more current is flowing through the cell. So, in order to have a certain current, one has to apply a voltage equal to
Ecell + ηH2 + ηCl2.
Here ηH2 and ηCl2 are the overpotentials for the cathode and anode.
The question now is, how much overpotential is needed for a certain current? In order to answer this question, one needs to know the relationship between current through an electrode/electrolyte interface and the voltage across that interface (the overpotential). The current/voltage relation is known and can be described by means of the Butler-Volmer equation. Below, this is covered in more detail for the interested reader. This is not a simple linear relation.
For now it suffices to mention, when currents in the order of magnitude of 1 A are wanted, then the required overpotential for each electrode usually only is a few mV, unless the electrode reaction generates a gas. Electrode reactions involving gas evolution may require overpotentials of several 100's of mV in order to proceed at an acceptable rate. In the electrolysis of NaCl, at both electrodes a gas is formed, so the required total overpotential is considerable in such an electrolysis cell. For practical setups, the total required overpotential ηH2 + ηCl2 usually is around 1 V. At lower overpotential, the current is very low and hence, electrode reactions become very slow.
Resistive losses in the liquid
Finally, the liquid (electrolyte) has a certain resistance, which depends on the concentration and the type of ions in the electrolyte. The ions need to move through the liquid and while doing so, they feel resistance (friction) from other ions and from water molecules. For an average cell and high electrolyte concentration this resistance is less than 1 Ω.
Summing it all up, the final model
The total electrolytic cell can be modeled as a series connection of five resistive elements:
-
A non-linear resistor, described by the Butler-Volmer equation. The main parameter of this resistor is the exchange current density for production of chlorine gas (see below for more details on this).
-
Redox potential for oxidation of chloride to chlorine. This is a highly non-linear resistor with the property, that when the applied voltage is below Eanode (1.36 V in this experiment), then no current flows at all. When the applied voltage goes above 1.36 V, then the current is unlimited. This is the characteristic of an ideal zener diode, connected in reverse direction and a rated zener voltage of 1.36 V.
-
A more or less linear resistor, which depends on the mobility of the ions in solution. This is less than 1 Ω for an average cell.
-
Redox potential for water to hydrogen. This is a highly non-linear resistor with the property, that when the applied voltage is below Ecathode (0.83 V in this experiment), then no current flows at all. When the applied voltage goes above 0.83 V, then the current is unlimited. This is the characteristic of an ideal zener diode, connected in reverse direction and a rated zener voltage of 0.83 V.
-
A non-linear resistor, described by the Butler-Volmer equation. The main parameter of this resistor is the exchange current density for production of hydrogen gas (see below for more details on this).
In a schematic diagram this looks as follows. At the left, the physical setup is shown, at the right the model, which describes the cell. The two ideal zener diodes in the model assure that at least Ecell=2.19 volts must be applied in order to have any current flowing. The resisters OP Cl2 and OP H2 are non-linear resistors, modeling the required overpotential (symbols with the /// inside the resistor symbol, indicating non-linearity). The resistor at the bottom models the ohm-like resistance of the electrolyte.
When the current through the cell is large enough (at least 100 mA), then roughly speaking, OP Cl2 and OP H2 can be described as ordinary semiconductor diodes, connected in the forward direction. A diode is characterized by a so-called forward voltage drop. For a normal silicon diode, this forward voltage drop is somewhere between 600 mV and 700 mV. For a germanium diode it is somewhere between 250 mV and 300 mV, and for a schottky diode it can be as low as 150 mV. The overpotentials can be modeled as diodes, with a certain forward voltage drop. For reactions, where no gas is formed, this forward voltage drop is only a few mV. For the reaction, studied here, it is several 100's of mV (e.g. 300 ... 700 mV). So, a good approximating model is the following:
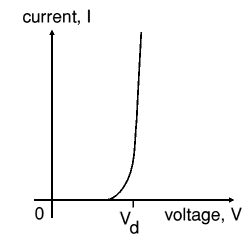
Beware: keep in mind that the diodes, drawn here, are not standard diodes. The forward voltage drop of these diodes is not the standard 600 .. 700 mV, but can be anywhere from a few mV to 1 V. Only the characteristic is like a diode, but the actual numeric values may differ considerably. The general characteristic of a diode is drawn in the picture at the left. The voltage Vd is the forward voltage drop of the diode in this model.
Once the forward voltage drop is determined for both electrodes, one has a very easy to use model for the electrolysis cell, which can easily be simulated, or even be built with real electronic components. Based on the measurements, one can derive the resistance, and the sum of the two forward voltage drops. Determining the individual forward voltage drops is more difficult and requires measurements inside the electrolyte.
Using the model, shown above, one can find a resistor somewhere between 0.7 and 1.0 Ω. More accurate determination of this value unfortunately is not possible, due to the coarse ampere-measurements. Only accuracy of 10% was available for the ampere-measurements. A better external ampere meter must be used for more accurate results. However, this experiment gives a good indication of the resistance of the electrolyte. With this resistance, a forward voltage drop of around 600 mV is found per electrode (total forward voltage drop is appr. 1.2 V). This means that the overpotential will be close to 1.2 V for a wide range of currents.
Remark: A second experiment was done, using a more accurate ampere meter. The results of that experiment can be found here: second experiment.
![]()
Advanced topic: Butler-Volmer equation and Tafel-approximation
The relation between the current density through the interface between the electrode and the electrolyte, and the overpotential can be described by means of the Butler-Volmer equation:
![]()
Here the meaning of the symbols is as follows:
-
R : the universal gas constant, which has value 8.3144 J mol-1 K-1.
-
T : the absolute temperature in Kelvin.
-
n : the number of electrons exchanged from ion to electrode. It equals 2 for NaCl, both at the anode and at the cathode (chloride → chlorine and water → hydroxide). In both cases, two electrons are needed, before a molecule of gas can be formed.
-
F : the Faraday constant, the number of Coulombs of charge in one mol of electrons. Its value equals 9.6485x10⁴ C mol-1.
-
η : the applied overpotential
-
α : the transfer coefficient of the electrode. Usually it is safe to assume this one being equal to 0.5. With this value, the electrode is symmetrical in the sense that the current density does not depend on whether it is an anode or a cathode (it has no rectifying effects and electrons can equally well be absorbed by the electrode or be given off by the electrode).
-
i0 : the exchange current density in A cm-2. This depends on the electrode material, and the gas, produced at the electrode, and the concentration of the electrolyte. This is the main parameter of an electrode/electrolyte interface.
-
i : the total current density in A cm-2.
When the applied overpotential is sufficiently large (50 ... 100 mV or more), then the current density as function of applied overpotential can be described as follows by means of Tafel's equation (which is a good approximation for positive overpotential of sufficient magnitude):
![]()
This equation looks very much like the equation for a semiconductor diode, operating in forward direction, where the current through the diode is given as an exponential function of the voltage across the diode. This explains, why in the model, given above, a diode-like component can be used for modeling the current as function of overpotential.
The total current then equals I = i · A. Here, A is the total surface area of the electrode in contact with the liquid. This explains the dramatic effect, which was observed, when the electrodes were raised out of the liquid with 3 cm. The total area of contact was halved approximately. The current density remained the same, hence the current was halved approximately as well.
The parameters i0 and A determine the observed forward voltage drop in the diode model, as given above. Suppose the nominal operating current of the cell is I, then the observed voltage drop Vd at room temperature equals
Vd = – (ln(A) + ln(i0) – ln(I)) / 40
The parameter A is the contact area in cm˛ and the parameter i0 can vary widely from the order of magnitude of nA per cm˛ (Vd in the order of magnitude of 100's of mV) to the order of magnitude of mA per cm˛ (Vd in the order of magnitude of millivolts).
This equation also shows that the forward voltage drop hardly depends on the actual current. If the current increases from 1 A to 2 A, then the voltage drop increases with ln(2)/40 volts, which only is 0.017 V.
Applying Tafel's formula to the experimental results
At room temperature, the numerical value for I equals
I = 15i0 exp(40η)
Here 15 is due to the contact area of the electrodes, this is approximately 15 cm˛. Determining the value of i0 is very difficult on the basis of the current measurements. Due to the exponential nature of I as function of the overpotential, the range is enormous.
Suppose that the forward voltage drop of the diode-model equals 500 mV, then the overpotential is somewhere near 500 mV as well. For a current of 1 A, this results in a exchange current density equal to 1.3·10-10 A cm-2. When the forward drop is 300 mV, then the exchange current density equals 4.1·10-7 A cm-2.
So, in order to determine the exchange current density of the electrodes, a much more accurate set of measurements has to be made. However, the diode/zener/resistor model, as described in the section above, provides a very useful model for predicting the behavior of an electrolysis cell, and that model does not need one to determine the precise exchange current density i0. From experimental data, it is easier to determine the total forward voltage drop.